Hi there!
As we know it, Covid-19 pandemic has been the prime highlight of this year. It has been directly affecting our way of living and has also made some serious dents to global social-economic dynamics. And there are lots of people, who have been continually working to understand, fight and control this epidemic. So, it is all of our common responsibility to help this endeavor with as much as we can.
So, on this blog series, I’d like to demonstrate how we can utilize BigData and Cloud Computing to analyze Covid-19 epidemic. If you’re someone who is interested in BigData, Cloud, DevOps, Data Science or even medical fields, you may find something useful from these posts. This project also involves several coding (Python) section, template writing, data querying, visualization methods, and so on. Therefore, I’ll also prepare video tutorials to walk you through the steps I took in detail. Hence, I hope anyone with fundamental IT knowledge would be able to follow along.
That being said, let’s look at the architecture diagram illustrating the components that I’m using. As you can see, I’m primarily using Amazon Web Services for this purpose. I’m certain other cloud services would also have equivalent services to help accomplish similar use case.
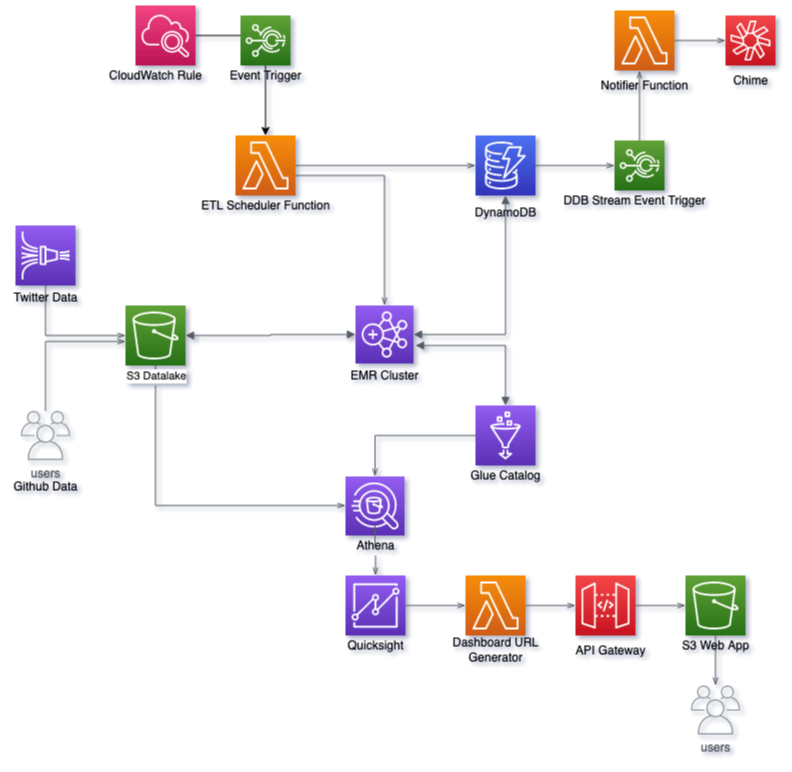
To elaborate, below are the workflow:
- We’ve 2 data sources here, which are then written to our main S3 bucket (datalake):
- Covid-19 stats: Maintained and published by John Hopkins University and available in this Github repository. It is updated in daily basis and contains very useful information such as total confirmed cases, deaths, recovered cases, incident rate, case fatality ratio by country, state and coordinates.
- Twitter data: These are mainly tweets related to Covid-19. These arrive in almost real-time and are fetched via Twitter Developer method and written to S3 bucket using service like Kinesis Firehose.
- After the data come into the S3 bucket, we’ll run our applications on top of these data. For this, I’m using Spark on top of Elastic Map Reduce (EMR) service. Spark will read the incoming raw data, process them into desired layout/format and then write the processed results back to S3. While doing so, it’ll also utilize Glue Data Catalog to store the table metadata.
- Basically, above 2 are the main components to get this project going. Nevertheless, it is better to implement some additional mechanism to properly automate, monitor and manage the workflow. For this, I’m introducing below components:
- Lambda Function to submit Spark job to EMR via Step. This function is one of the main components in this architecture as it determines which job to submit, when and how. It also puts a record in predefined DynamoDB table to keep track of jobs submitted to EMR. Additionally, it also has logic to handle several scenarios such as determining concerned EMR cluster, adding required partition into Glue table, drafting arguments to pass with job submission, preventing duplicate job submission, and so on.
- To invoke above Lambda function in daily basis, a CloudWatch scheduled rule is used. Whereas to process past data, we’ll invoke this function manually or with a script.
- As mentioned above, we use DynamoDB table here to keep track of the ETL jobs. This is updated by above Lambda function as well as the Spark ETL jobs. And we also enable Stream on this table and use it to trigger another Lambda function, which is designed to send notifications. So that, whenever an item gets updated in DynamoDB table, it’ll invoke the function.
- The notifier function takes the updated DynamoDB record and pushes it to destination, which in this case is Amazon Chime chatroom. Similarly, other communication tools like Slack, Team, etc. can also be used to receive notifications. This function also does some formatting to make the notifications more user friendly.
- Then, we get into another part of this project, which is to analyze and visualize the processed data. As can be seen in the diagram, we’ll be using Athena and QuickSight for this purpose. And lastly to share the visualization dashboard with our users, we’ll be utilizing yet another Lambda function and API Gateway, and then embed it to a static webpage hosted in S3 bucket.
- Finally, to wrap this up, we’ll be writing a CloudFormation template(s) to launch all these components as a single stack. This way, it can be easily automated and managed.
And there you have it. That’s all for now, and we’ll be diving deep into each part in upcoming posts. Till then, take care and have fun! And here’s a Dashboard I’ve created: https://covid19.sajjan.com.np

Leave a Reply